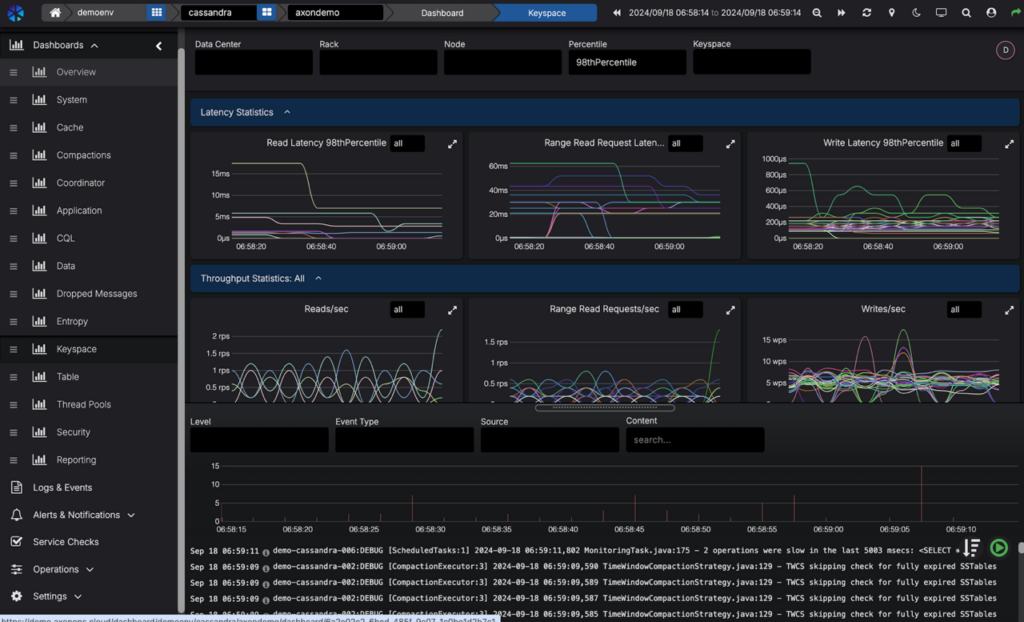
Apache Cassandra is a highly scalable, distributed NoSQL database used by many organizations to handle large volumes of data across multiple nodes. However, to ensure optimal performance and reliability of a Cassandra cluster, comprehensive monitoring is essential. This article will explore the most important metrics to monitor in Cassandra and provide guidance on implementing an effective monitoring strategy.
Key Metrics for Cassandra Performance Monitoring
When looking to monitor Cassandra performance, there are several critical metrics that have the greatest impact on cluster health and efficiency:
1. Read/Write Latency
Read and write latency are among the most crucial Cassandra performance metrics to track. These measure the time it takes for read and write operations to complete.
Why it’s important: High latency directly impacts application performance and user experience. Monitoring these metrics helps identify bottlenecks and optimize query performance.
2. Throughput
Throughput measures the number of client requests (reads and writes) processed per second.
Why it’s important: This metric indicates the overall capacity and utilization of your Cassandra cluster. Tracking throughput helps with capacity planning and identifying potential scalability issues.
3. Pending Tasks
This metric shows the number of queued operations waiting to be executed.
Why it’s important: A high number of pending tasks can indicate that the cluster is overloaded and unable to keep up with incoming requests. This can lead to increased latency and potential timeouts.
4. Garbage Collection Metrics
As Cassandra runs on the Java Virtual Machine (JVM), garbage collection (GC) metrics are critical for performance tuning.
Why it’s important: Frequent or long-running garbage collection cycles can cause latency spikes and impact overall cluster performance. Monitoring GC metrics helps optimize JVM settings and memory allocation.
5. Disk Usage
Tracking disk usage across nodes is crucial for maintaining cluster health.
Why it’s important: Running out of disk space can cause node failures and data loss. Monitoring disk usage helps with capacity planning and ensures proper data distribution across the cluster.
6. Compaction Metrics
Compaction is a background process that merges SSTables and removes deleted data.
Why it’s important: Monitoring compaction metrics helps ensure that compactions are keeping up with write operations. Falling behind on compactions can lead to degraded read performance and increased disk usage.
7. Cache Hit Rates
Cassandra uses various caches to improve read performance. Monitoring cache hit rates helps optimize cache settings.
Why it’s important: Low cache hit rates can indicate that cache sizes may need adjustment or that query patterns are not optimal for caching.
8. Dropped Messages
This metric shows the number of internal messages that were dropped due to overload or timeouts.
Why it’s important: A high number of dropped messages can indicate network issues or an overloaded cluster, potentially leading to data inconsistencies.
9. Repair-related Metrics
Repair operations ensure data consistency across replicas. Monitoring repair metrics is crucial for maintaining data integrity.
Why it’s important: Failed or slow repairs can lead to data inconsistencies and impact read performance. Tracking these metrics helps ensure the overall health of your data.
10. Node Status
Monitoring the status of individual nodes in the cluster is fundamental to Cassandra performance monitoring.
Why it’s important: Node failures or performance issues can impact the entire cluster. Quickly identifying and addressing node-level problems is crucial for maintaining cluster stability.
Implementing Effective Cassandra Monitoring
To effectively monitor Cassandra performance, consider the following best practices:
- Use dedicated Cassandra monitoring tools: Utilize specialized tools designed for Cassandra monitoring. These often provide pre-configured dashboards and alerts tailored to Cassandra’s specific metrics.
- Set up comprehensive dashboards: Create dashboards that give a holistic view of your Cassandra cluster’s performance, including all the key metrics mentioned above.
- Implement alerting: Configure alerts for critical thresholds on key metrics to proactively identify and address issues before they impact performance.
- Monitor at multiple levels: Track metrics at the cluster, node, and table levels to get a comprehensive understanding of your system’s performance.
- Correlate metrics: Look for relationships between different metrics to gain deeper insights into performance issues and their root causes.
- Regularly review and adjust: Continuously review your monitoring setup and adjust thresholds and alerts as your cluster grows and workload patterns change.
- Combine metrics and logs: Integrate metric monitoring with log analysis for a more complete picture of your Cassandra cluster’s health and performance.
Conclusion
Effective Apache Cassandra monitoring is crucial for maintaining optimal performance, reliability, and scalability of your database cluster. By focusing on key performance metrics such as read/write latency, throughput, pending tasks, and others discussed in this article, you can gain valuable insights into your cluster’s health and proactively address potential issues.
To truly optimize Cassandra performance, it’s essential to implement robust monitoring tools in combination with a well-planned alerting framework. This approach enables you to quickly identify and resolve performance bottlenecks, ensure data consistency, and maintain high availability for your applications.
Remember that Cassandra performance tuning is an ongoing process. Regularly review your monitoring setup, analyze trends in your metrics, and adjust your configuration as needed. With the right monitoring strategy in place, you can ensure that your Apache Cassandra cluster continues to meet the demands of your growing data and user base.
By investing in comprehensive Cassandra monitoring and performance tuning, you’re not just maintaining a database – you’re safeguarding the backbone of your data-driven applications and ensuring they can scale reliably to meet future challenges.

